Qualitatively, I disagree that one offsets the other. A team striving to be the best should be able to both hold their own leads and comeback from being a goal down. However I will concede that statistically in terms of league points, they balance out. And emotionally too; for as soul-destroying a lost lead is, nothing stirs the blood like snatching a draw from
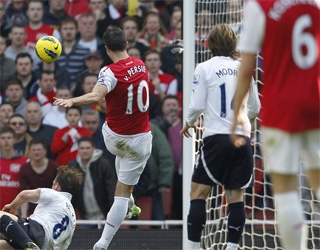
If you’ve known me for a while, you know that I’m a stickler for lost leads. Nothing infuriates me more than Arsenal crumbling and throwing away a winning position. We’ve done all sorts over the years: from run-of-the-mill 1-1 stalemates having been a goal ahead, to losing 3-2 at home to Spurs despite being 2-0 up, to a multitude of 4-4 draws (in each of which we’ve conceded a last-minute equaliser).
After that 3-2 defeat at home to Spurs in November 2010, I wrote this – http://www.arsenalvision.co.uk/articles/3436-34-reasons-why-weve-gone-five-years-without-a-trophy.html. People said just producing a list was no good, that it need context such as comparison with our rivals. And they were right.
Therefore a year later, I wrote this – http://www.arsenalvision.co.uk/articles/3805-the-list-of-lost-leads-a-comparative-analysis-with-our-rivals-.html – extending my first piece to include teams around us; namely Manchester United, Chelsea, Liverpool and Tottenham Hotspur (Manchester City weren’t big enough in 2005/06; being the start-date of my research).
The results were showed that Arsenal weren’t statistically the worst of the quintet at throwing away leads. That “honour” belonged to our good friends from down the road. At the time of writing that article, Spurs had thrown away 49 leads over the six-and-a-bit seasons compared to our 42. Not overly surprising when you consider they never challenged for the title during this period, with fourth-place being their absolute maximum limit. Some things never change.
Excluding Spurs, Chelsea were roughly on a par with us having given up 41 leads. Interestingly none of these were two-goal leads, unlike Arsenal who had blown six such cushions (not to mention the infamous four-goal buffer at Newcastle in February 2011).
So when looking at teams which had genuinely challenged for the title, we were bottom of the pile. Manchester United led the way with just 31 leads conceded, and Liverpool trailed surprisingly closely behind with 34. Chelsea and Arsenal were nearly level with 41 and 42 respectively.
Since then our figure has risen to 46. I haven’t updated my records for our rivals, though I may do so later this summer.
But I digress. This article isn’t about lost leads. It is about comebacks. In both my above pieces, it was suggested that I was being too harsh on Arsenal; that I should look at the opposite scenario where we’d come from behind to salvage something.
Qualitatively, I disagree that one offsets the other. A team striving to be the best should be able to both hold their own leads and comeback from being a goal down. However I will concede that statistically in terms of league points, they balance out. And emotionally too; for as soul-destroying a lost lead is, nothing stirs the blood like snatching a draw from the jaws of defeat with a late equaliser, or using the momentum of an equaliser to grab a last-gasp winner.
In a season typified by comebacks – both on the pitch and in the league table – it is only fitting that I produce this list now. So here it is. Feel free to bask in its mental strength-coated glory:
(first scoreline indicates our deficit at any stage in the game; second scoreline is the final result; and games in bold are wins)
2005/06:
-
Fulham(h) – Premiership – 0-1; 4-1
-
Spurs(a) – Premiership – 0-1; 1-1
-
Doncaster(a) – Carling Cup – 1-2; 2-2 (Arsenal win on penalties)
-
Bolton(h) – Premiership – 0-1; 1-1
-
Spurs(h) – Premiership – 0-1; 1-1
-
Wigan(h) – Premiership – 1-2; 4-2
In total we were behind at some stage in 21 games, so coming from behind six times gives a comeback rate of 29% (comprising 14.5% wins and 14.5% draws)
2006/07:
-
Villa(h) – Premiership – 0-1; 1-1
-
Dinamo Zagreb(h) – Champions League – 0-1; 2-1
-
Middlesbrough(h) – Premiership – 0-1; 1-1
-
Charlton(a) – Premiership – 0-1; 2-1
-
Everton(h) – Premiership – 0-1; 1-1
-
Newcastle(h) – Premiership – 0-1; 1-1
-
Hamburg(h) – Champions League – 0-1; 3-1
-
Portsmouth(h) – Premiership – 0-2; 2-2
-
Blackburn(h) – Premiership – 0-1; 6-2
-
Man Utd(h) – Premiership – 0-1; 2-1
-
Spurs(a) – Carling Cup – 0-2; 2-2
-
Bolton(h) – FA Cup – 0-1; 1-1
-
Middlesbrough(a) – Premiership – 0-1; 1-1
-
Wigan(h) – Premiership – 0-1; 2-1
-
Bolton(h) – Premiership – 0-1; 2-1
In total we were behind at some stage in 28 games, so coming from behind 15 times gives a comeback rate of 54% (comprising 25% wins and 29% draws)
2007/08:
-
Fulham(h) – Premiership – 0-1; 2-1
-
Spurs(a) – Premiership – 0-1; 3-1
-
Liverpool(a) – Premiership – 0-1; 1-1
-
Man Utd(h) – Premiership – 1-2; 2-2
-
Villa(a) – Premiership – 0-1; 2-1
-
Everton(a) – Premiership – 0-1; 4-1
-
Spurs(h) – Carling Cup – 0-1; 1-1
-
Villa(h) – Premiership – 0-1; 1-1
-
Middlesbrough(h) – Premiership – 0-1; 1-1
-
Bolton(a) – Premiership – 0-2; 3-2
-
Liverpool(h) – Premiership – 0-1; 1-1
In total we were behind at some stage in 19 games, so coming from behind 11 times gives a comeback rate of 58% (comprising 26% wins and 32% draws)
2008/09:
-
Dynamo Kiev(a) – Champions League – 0-1; 1-1
-
Bolton(a) – Premiership – 0-1; 3-1
-
Sunderland(a) – Premiership – 0-1; 1-1
-
Everton(h) – Premiership – 0-1; 3-1
-
Chelsea(a) – Premiership – 0-1; 2-1
-
Everton(a) – Premiership – 0-1; 1-1
-
Hull(h) – FA Cup – 0-1; 2-1
-
Villarreal(a) – Champions League – 0-1; 1-1
-
Wigan(a) – Premiership – 0-1; 4-1
In total we were behind at some stage in 23 games, so coming from behind nine times gives a comeback rate of 39% (comprising 22% wins and 17% draws)
2009/10:
-
Standard Liege(a) – Champions League – 0-2; 3-2
-
Blackburn(h) – Premiership – 0-1; 6-2
-
Liverpool(a) – Premiership – 0-1; 2-1
-
West Ham(a) – FA Cup – 0-1; 2-1
-
Everton(h) – Premiership – 1-2; 2-2
-
Bolton(h) – Premiership – 0-2; 4-2
-
Stoke(a) – Premiership – 0-1; 3-1
-
Barcelona(h) – Champions League – 0-2; 2-2
In total we were behind at some stage in 22 games, so coming from behind eight times gives a comeback rate of 36% (comprising 27% wins and 9% draws)
2010/11:
-
Liverpool(a) – Premiership – 0-1; 1-1
-
Birmingham(h) – Premiership – 0-1; 2-1
-
Leeds(h) – FA Cup – 0-1; 1-1
-
Everton(h) – Premiership – 0-1; 2-1
-
Barcelona(h) – Champions League – 0-1; 2-1
-
West Brom(h) – Premiership – 0-2; 2-2
-
Fulham(a) – Premiership – 1-2; 2-2
In total we were behind at some stage in 22 games, so coming from behind seven times gives a comeback rate of 32% (comprising 14% wins and 18% draws)
2011/12:
-
Udinese(a) – Champions League – 0-1; 2-1
-
Shrewsbury(h) – Carling Cup – 0-1; 3-1
-
Bolton(h) – Carling Cup – 0-1; 2-1
-
Chelsea(a) – Premiership – 1-2; 5-3
-
Norwich(a) – Premiership – 0-1; 2-1
-
Fulham(h) – Premiership – 0-1; 1-1
-
Villa(h) – FA Cup – 0-2; 3-2
-
Sunderland(a) – Premiership – 0-1; 2-1
-
Spurs(h) – Premiership – 0-2; 5-2
-
Liverpool(a) – Premiership – 0-1; 2-1
-
Newcastle(h) – Premiership – 0-1; 2-1
-
Stoke(a) – Premiership – 0-1; 1-1
-
West Brom(a) – Premiership – 1-2; 3-2
In total we were behind at some stage in 28 games, so coming from behind 13 times gives a comeback rate of 46% (comprising 39% wins and 7% draws)
(N.B. the list excludes games where we come from behind but then contrive to concede an equaliser/winner, such as this season’s 3-3 draw with Norwich. This type of game is on the “naughty” list. Whilst Opta includes such circumstances as a point salvaged, for my analysis I put more weight on the final act, whereby Norwich scored the last goal)
Of the 69 comebacks, 40 were wins and 29 were draws. This is somewhat surprising. Not only do we equalise, but we often push on and grab a winner too. The value of momentum, eh?
Before drawing more conclusions, here’s the season-by-season breakdown:
2005/06: 3 wins and 3 draws (total = 6)
2006/07: 7 wins and 8 draws (total = 15)
2007/08: 5 wins and 6 draws (total = 11)
2008/09: 5 wins and 4 draws (total = 9)
2009/10: 6 wins and 2 draws (total = 8)
2010/11: 3 wins and 4 draws (total = 7)
2011/12: 11 wins and 2 draws (total = 13)
The two seasons that stand out are 2006/07 and 2011/12.
If we exclude 2011/12, the total figures stand at 29 wins and 27 draws. This is more expected as it is closer to a 50:50 ratio. Winning 11 out of 13 last season (85%) was a superhuman effort. No wonder many fans believe we finally have a squad which truly does exhibit mental strength.
The other anomaly is 2006/07, being the inaugural season at the Emirates. Our early run of results at THOF2 was typified by conceding the first goal but then summoning the courage to find an equaliser. Look at the results and you will see numerous 1-1 home draws as we struggled to settle into our new surroundings. By the end of the campaign, we began turning these draws into wins.
Over the entire seven-years, the home/away split is 38 to 31. This is in line with the expectation that we would be stronger on home soil and roared on by the Highbury/Emirates faithful.
Naturally, the majority of matches occur in the league (51 of the 69). These 51 games comprise 29 wins and 22 draws. Here is a further breakdown of our league results, including points recovered:
2005/06: 2 wins and 3 draws (5 games, 9 points)
2006/07: 5 wins and 6 draws (11 games, 21 points)
2007/08: 5 wins and 5 draws (10 games, 20 points)
2008/09: 4 wins and 2 draws (6 games, 14 points)
2009/10: 4 wins and 1 draw (5 games, 13 points)
2010/11: 2 wins and 3 draws (5 games, 9 points)
2011/12: 7 wins and 2 draws (9 games, 23 points)
A total of 109 points over seven seasons equates to roughly 15.5 points a season. On three occasions we have outperformed this: 2006/07 and 2011/12, which I have referred to above; and 2007/08, where we played like Champions elect for two-thirds of the campaign until THAT game in Birmingham.
The most intriguing disparity is from 2010/11 to 2011/12. How could a team battered by a poor summer in the transfer market and a shocking start to the season outdo its more talented predecessor?
Numbers alone don’t paint the full story. For instance, perhaps we didn’t comeback as much in 2010/11 because we didn’t need to, i.e. maybe we just didn’t fall behind that much? Similarly, in 2011/12 we may have such a high figure because we conceded the first goal so often.
This issue is solved by calculating the “comeback rate” at the end of each season. This involves dividing the number of successful comebacks (the games I have listed) by ALL the games in which we fell behind (the games I have listed plus games we did not salvage anything from), as follows:
Comeback rate = Successful comebacks
Successful comebacks + Unsuccessful comebacks
Graphically, our “comeback rate” over the years is as follows:
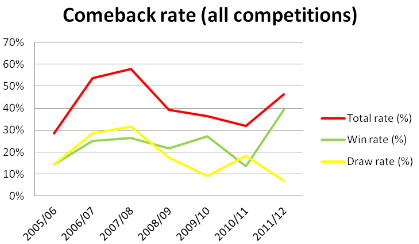
Before discussing the “comeback rate”, it is important to highlight the number of times we were behind. Apart from 2006/07 and 2011/12 (yep, those two seasons again), the number only ranged from 19 to 23. In those aforementioned two seasons, the number was 28 for each. I’ve already discussed why it was so high in 2006/07 (first season at the Emirates), but why so high last season? I can only infer that this is because a decline in our gameplay, be it a slower tempo from kickoff or just a basic drop in quality.
The high points in the total rate are 2006/07 and 2007/08. The latter of these was the season where we legitimately looked like a team that could go all the way and win the league.
Since then we experienced a steady and gradual decrease in the total rate which coincided with the notion that, for all of Arsene’s words, we didn’t display enough of the fabled mental strength.
Until this past season.
Yes we fell behind far too many times, but the players and manager deserve a huge amount of credit for pulling it back so often. And never mind just pulling it back, but also going on to win the game. Seeing as we only secured Champions League football by a single point, how crucial is it that none of the comeback league wins weren’t “downgraded” to a draw?
While 2011/12’s total rate is less than 2006/07 or 2007/08, its win rate is the highest by some margin. This falls perfectly in line with the theory that although the squad was one of Arsene’s weakest (be it ravaged by departures or injury), it also showed greater strength in adversity than more talented squads of previous years.
Where next? On a personal note, I might do the same analysis with our rivals to see how we compare and publish it later this summer.
From Arsenal’s point of view, it would be great if we could combine the mental strength of this past season with the sheer quality of the 20
07/08 side. That way we wouldn’t fall behind so often, but if we did then we’d have the dogedness and determination to comeback and win.
Squid Boy (https://twitter.com/#!/TheSquidBoyLike)